Solar power plant

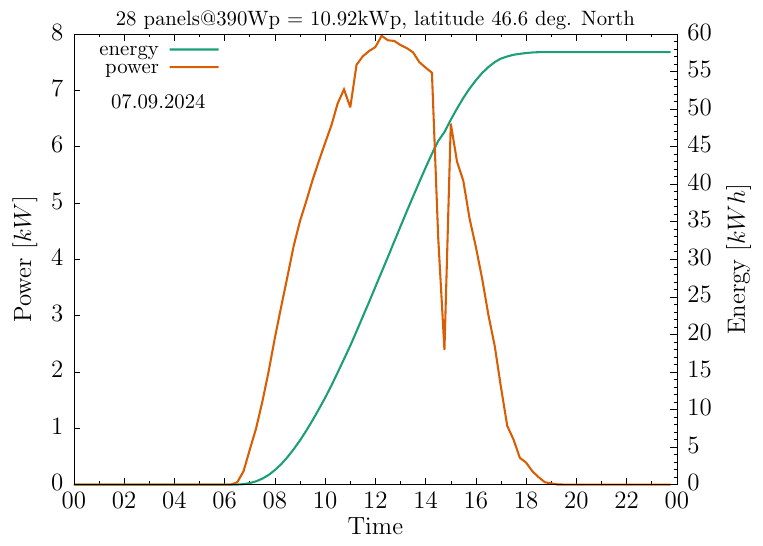
The plot shows energy production (in kWh) and power output (in kW) for yesterday.
Last seven days of energy and power production.
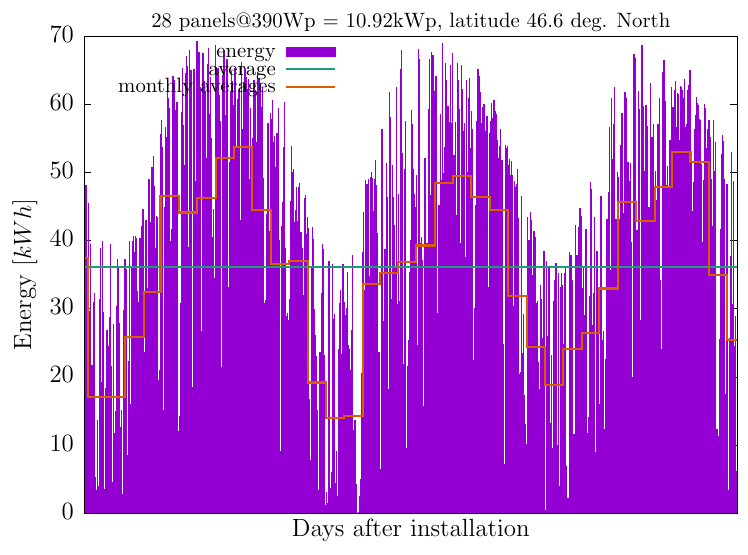
Daily energy production in kWh.
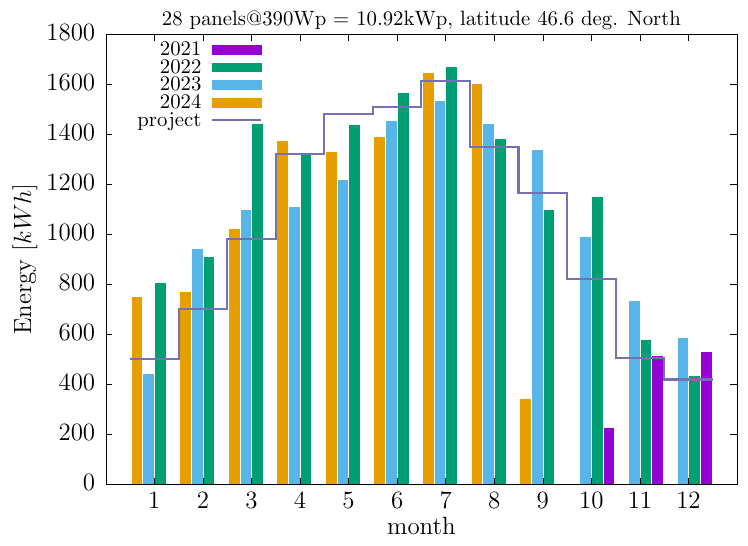
Monthly total energy production compared with production foreseen by the designers.
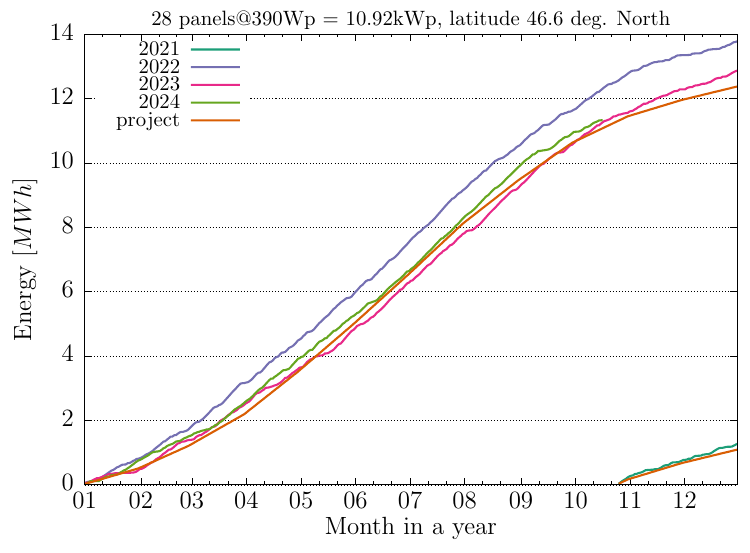
The energy produced in a year compared to values the designers foreseen in the project
The total energy in specific hours in a day
The energy produced in 365 consecutive days (first data point: 26.10.2021 -> 25.10.2022)

Site details:
– Installation date 26-oct-2021
– 28 Q-Cells panels, model Q.PEAK DUO ML-G9 390W
– panel size 184 cm x 103 cm, area 1.9 m^2
– 22 facing South, 3 facing East, 3 facing West
– total area 53 m^2
– Inverter: SolarEdge SE16K
– Power optimizers: SolarEdge P401

1 comment

  1. Super narejene preglednice. Prav zanima me kakšne bodo številke poleti, ko bo sonce sijalo kar nekaj ur več kot sedaj.

Leave a comment

Your email address will not be published. Required fields are marked *